A monthly dashboard should answer three questions: what happened, why it happened and what management will do next. If it only displays numbers, it is a report. If it changes priorities and ownership, it is a management system.
Keep the first version small. Cash balance, collections, revenue, gross margin, qualified pipeline, conversion, delivery capacity and the most important operational exception are usually enough. Each metric needs a definition, owner, source and review frequency — written down, not assumed.
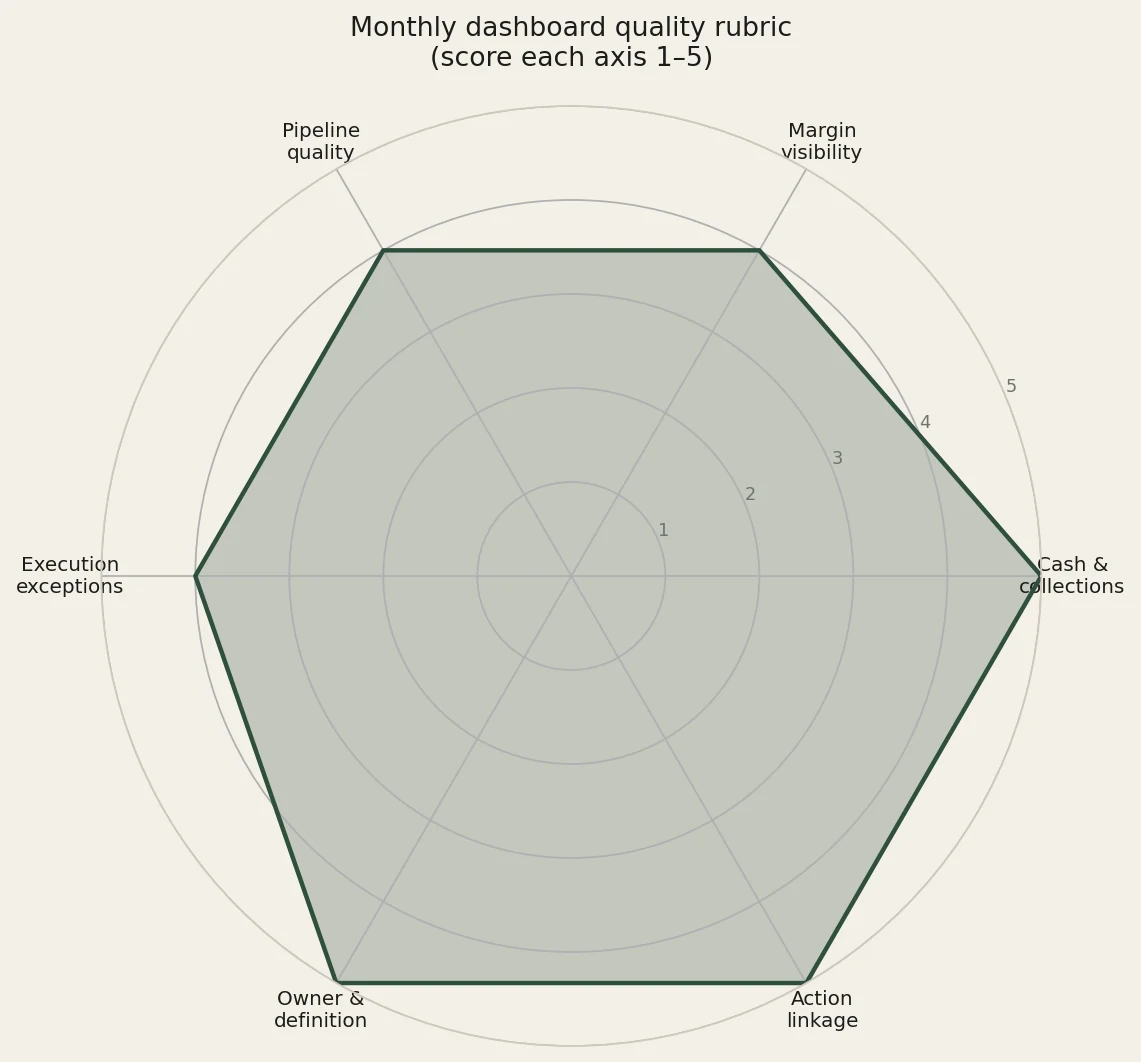
Dashboard quality rubric (score 1–5)
| Axis | Weak (1–2) | Strong (4–5) | Your score |
|---|---|---|---|
| Cash & collections | Bank balance only, no ageing | Cash, runway view and collections ownership | ___ |
| Margin visibility | Revenue without cost context | Gross margin with clear definitions | ___ |
| Pipeline quality | Total leads vanity count | Qualified pipeline and conversion | ___ |
| Execution exceptions | No operating red flags | Top exceptions with owners | ___ |
| Owner & definition | Metrics argue every month | Dictionary + named owners | ___ |
| Action linkage | Slides then silence | Decisions and owners recorded | ___ |
Tooling without competing sources of truth
Databox is a candidate for businesses that want dashboards across multiple systems. Notion can support the commentary layer: assumptions, decisions, action owners and source links. Use one tool for visualisation and one for context — not competing versions of the same KPI.
Set a monthly rhythm: close the period, reconcile source data, explain material variances, agree actions and record the decision. Restrict edit access, date refreshes, preserve snapshots and document manual adjustments.
Build sequence for month one
Week 1: agree metric dictionary and owners. Week 2: connect sources and validate one month of history. Week 3: run a dry-run review with commentary. Week 4: lock the pack, remove vanity charts, and schedule the recurring meeting. If a chart does not change a decision, delete it.
Monday-morning checklist
- Confirm data refresh date and source systems on the dashboard header.
- Highlight only material variances — prepare one sentence of “why” each.
- Review cash and collections before marketing vanity metrics.
- Capture decisions and owners in the commentary layer the same day.
- Park any new metric request until next month’s dictionary review.
Disclaimer
Educational content only. Tool features, pricing and partner terms should be verified before purchase. Management teams should adapt KPI definitions to their own business model. Not financial or investment advice — see also SEBI investor education for general investor-protection resources.
Start from decisions, not from charts
List the five decisions leadership actually makes each month: hiring, pricing, collections focus, product mix, marketing spend, delivery capacity. Then ask which metrics change those decisions. Everything else is decoration. Owners who begin with “we need a dashboard like Company X” usually inherit vanity metrics and skip the hard work of definitions.
Write a metric dictionary: name, formula, source system, refresh timing, owner, and the decision it informs. Argue once in the dictionary, not every month in the meeting.
Cash first, then margin, then growth theatre
Many SME packs lead with website traffic or social engagement while cash and collections sit on a secondary tab. Invert that. Cash balance, expected receipts, overdue collections and near-term commitments belong on the first screen. Margin follows. Pipeline quality follows after that. Marketing activity metrics can exist — they should not crowd out solvency and contribution.
When numbers conflict across CRM, billing and bank, fix the reconciliation process before adding more visualisations. A beautiful wrong chart is still wrong.
Operating rhythm that makes the pack real
Close and reconcile. Refresh the dashboard. Draft variance commentary. Hold a short review with owners present. Record decisions and due dates. Follow up mid-month on exceptions only. If the meeting becomes a slide recital with no owners, shorten the pack until behaviour changes.
Preserve monthly snapshots. Without history, every discussion reboots. Snapshotting also helps when someone “fixes” a source system mid-period and accidentally revises the story.
Choosing visualisation versus commentary tools
Use a dashboard product when you need live connectors and shared visual packs. Use a knowledge tool for narrative, assumptions and action logs. Mixing both jobs into one overloaded page usually creates either unread essays or charts without context. Databox and Notion are examples of that split — confirm current features on their official sites — but the architecture matters more than the logo.
Whatever you pick, restrict edit rights, label manual overrides, and make the refresh timestamp obvious. Trust dies quietly when nobody knows whether the pack is yesterday’s or last quarter’s.
Exceptions deserve their own strip
A healthy monthly pack includes a short exceptions strip: top overdue invoices, top delivery slips, unfinished close items, or capacity breaches — whatever actually derails your month. Each exception needs an owner and a next date. Without that strip, leadership debates averages while the business burns on a few known problems.
Refresh the exceptions mid-month in a lightweight view. Monthly-only exception reviews train the organisation to wait for the meeting instead of fixing what is already obvious.
Finally, retire metrics ruthlessly. If a chart has not changed a decision in two consecutive months, remove it. Empty space is clearer than polite clutter.